
The 5M ORD Scan
Measure the distance between what your organisation says and how it really works
Forty-eight statements that take about fifteen minutes, answered anonymously by people at every level. The scan maps the gaps between the Front Door, the Inner Room and the Back Room, and turns them into recommendations drawn from Stitch In Time.
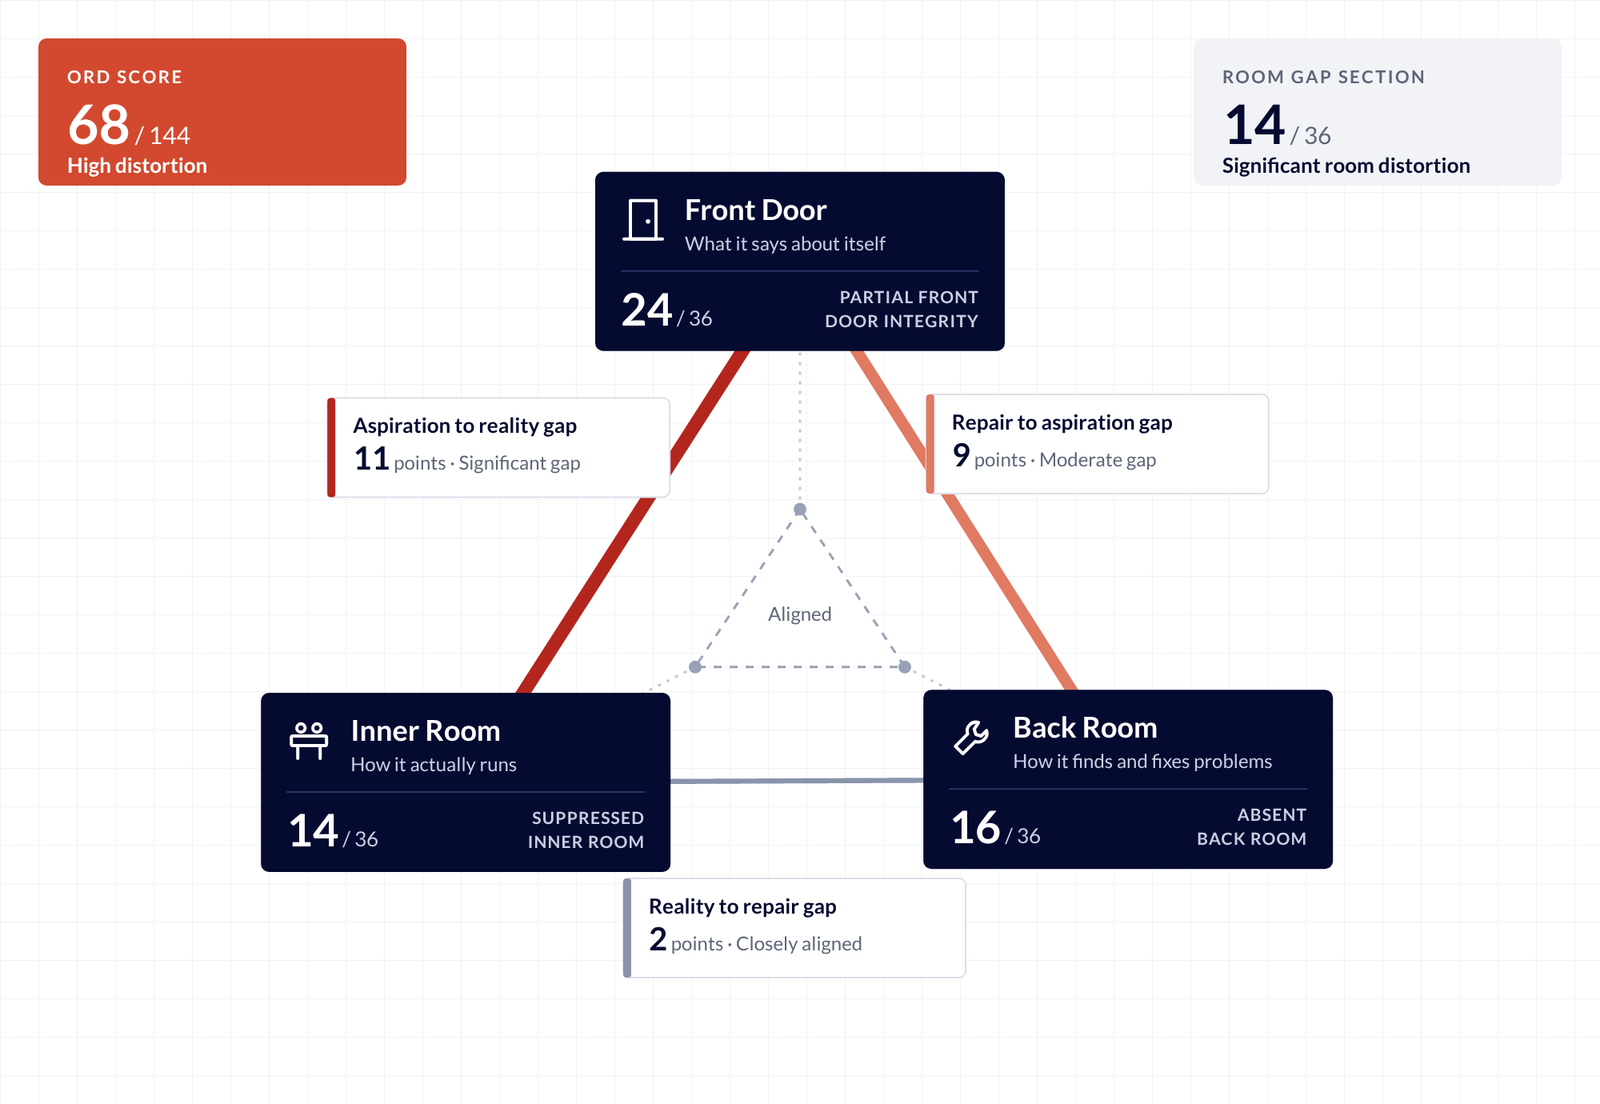
The three rooms, in plain terms
The strategy, the board pack, the annual report and the values on the wall.
Corridor conversations, workarounds, and what staff know but do not say in meetings.
The forums, the authority and the habit of fixing causes, so problems stay fixed.
Why it pays, for an everyday organisation
Distortion is felt in ordinary business results long before it reaches a board paper. The scan shows where your organisation is exposed to six common and costly problems.
Decisions made on an edited picture
Problems reach the executive team late and softened, so fixes cost more by the time they are approved.
The same problems keep coming back
Rework, overtime and senior time spent on the same issues, quarter after quarter.
Good people stop speaking up, then leave
Concerns stay in the corridor, and capable staff disengage and move on.
Customers feel problems first
Complaints and service failures that front-line staff see but cannot get fixed.
Regulatory and financial surprises
Fines, audit findings and write-offs that someone inside saw coming.
Money spent away from strategy
Budgets and leadership time spent away from the agreed priorities, and critical teams stretched too far.
For each one, the report shows how exposed the organisation is, what it looks like day to day, the Stitch In Time instrument that fixes it, and the measure that will show the fix is working.
Step into a respondent’s shoes
Take the scan
Answer the forty-eight statements about an organisation you know. Your answers stay on your device, and you see your own distortion map at the end.
Take the demo scanWhat leaders receive
See a sample report
The full findings and recommendations for a fictional organisation of thirty-four respondents, from the distortion map to the ninety-day repair plan.
Open the sample reportHow the consultant works
Explore the console
See how an engagement is set up, how responses come in by level, and how recommendations are drafted and edited before the report is released.
Open the demo consoleFor respondents
Take the survey
Enter the six-character code your organisation sent you.
For sponsors
Open your report
Enter the private report key you received once your results were released.
For 5M consultants
Consultant console
Set up engagements, invite respondents, follow the responses, and prepare and release reports.
Sign inHow a full scan runs
Set up
5M sets up the engagement, with the organisation’s context, its departments and a target number of people from each level.
Invite
People take the scan in their own offices on a phone or computer, on a shared tablet, or on paper. One sponsor can also invite a handful of colleagues.
Read
Results build as answers come in: the distortion map, the score, the view from each level and every statement.
Repair
The consultant reviews the drafted recommendations, adds what interviews revealed and releases the report to the sponsor.